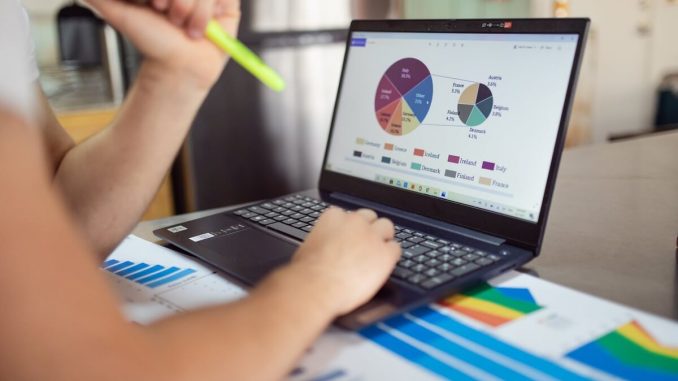
In the ever-evolving landscape of Search Engine Optimization (SEO), the incorporation of visual elements has become paramount. Infographics, with their ability to convey complex information in a visually appealing and digestible format, have emerged as powerful tools for enhancing SEO strategies. This comprehensive guide delves into the synergy between infographics and SEO, exploring how these visual assets can elevate your digital presence, boost engagement, and contribute to overall search engine success.
I. Understanding the Impact of Visual Content in SEO
- The Visual Advantage:

- Cognitive Efficiency: Visual content is processed faster by the brain, making it an effective way to communicate information.
- Enhanced Engagement: Infographics can capture and maintain audience attention, reducing bounce rates and signaling relevance to search engines.
- SEO and User Experience:
- Dwell Time Impact: Engaging infographics can increase dwell time, a metric search engines consider when evaluating the quality of a page.
- Reduced Bounce Rates: Informative and visually stimulating content encourages users to stay on the page, contributing to lower bounce rates.
II. Crafting SEO-Optimized Infographics
- Keyword Integration:
- Strategic Placement: Integrate relevant keywords into the infographic title, headings, and captions.
- Alt Text Optimization: Provide descriptive alt text for images within the infographic to enhance accessibility and SEO.
- Content Relevance:
- Align with Content Themes: Ensure that the infographic aligns with the overall theme and content of the webpage.
- Keyword Consistency: Maintain consistency between the infographic content and the targeted keywords.
III. Infographics as Linkable Assets
- Link-Worthy Visuals:
- Shareability: Infographics are highly shareable, increasing the likelihood of attracting natural backlinks.
- Embed Codes: Provide an embed code for your infographic to make it easy for others to share and link back to your site.
- Outreach Strategies:
- Targeting Influencers: Identify and reach out to influencers or bloggers in your industry who may find your infographic valuable.
- Guest Posts and Collaborations: Offer to create custom infographics for guest posts on relevant websites, fostering backlinks.
IV. Enhancing Social Signals
- Social Media Amplification:
- Visual Appeal on Social Platforms: Infographics stand out on social media platforms, increasing the likelihood of shares and engagement.
- Hashtags and Trends: Leverage relevant hashtags and current trends to amplify the reach of your infographic on social media.
- Pinterest as a Visual Search Engine:
- Optimizing for Pinterest: Create pinnable infographics with compelling visuals and keyword-rich descriptions.
- Linking to Website: Ensure each pin links back to your website, driving traffic and enhancing SEO.
V. Improving Page Loading Speed
- Optimizing Image Sizes:
- File Compression: Compress infographic images without compromising quality to reduce page loading times.
- Image Formats: Choose appropriate image formats (e.g., JPEG, PNG) for optimal loading speed.
- Mobile-Friendly Infographics:
- Responsive Design: Ensure that your infographics are mobile-friendly and adjust seamlessly to various screen sizes.
- Mobile Page Speed: Optimize images and design elements for faster loading on mobile devices.
VI. Infographics in Content Marketing Strategies
- Content Variety:
- Diversified Content Portfolio: Infographics complement written content, providing variety and catering to different learning preferences.
- Repurposing Content: Transform existing content into visually appealing infographics, extending its lifespan and reach.
- Educational and Informative Value:
- Industry Insights: Create infographics that communicate industry trends, statistics, or step-by-step guides.
- Problem-Solution Format: Craft infographics that address common challenges in your industry, positioning your brand as a valuable resource.
VII. Measuring Infographic Success
- Analytics and Tracking:
- Traffic Sources: Analyze traffic sources to identify the impact of infographics on website visits.
- Backlink Monitoring: Track the acquisition of new backlinks resulting from infographic distribution.
- User Interaction Metrics:
- Time on Page: Monitor the average time users spend on pages containing infographics.
- Social Shares: Gauge the success of infographics by tracking social shares across different platforms.

Visualizing SEO Triumphs with Infographics
In the dynamic world of SEO, where attention is a scarce commodity, infographics stand as beacons of engagement and information. By seamlessly blending visual appeal with strategic SEO practices, infographics become potent assets in your digital arsenal. From boosting user experience and garnering natural backlinks to enhancing social signals and diversifying content portfolios, infographics play a multifaceted role in the SEO landscape. As you embark on the journey of creating SEO-optimized infographics, remember that each visual asset is not just an image; it’s a gateway to enhanced visibility, engagement, and digital triumphs.

Leave a Reply